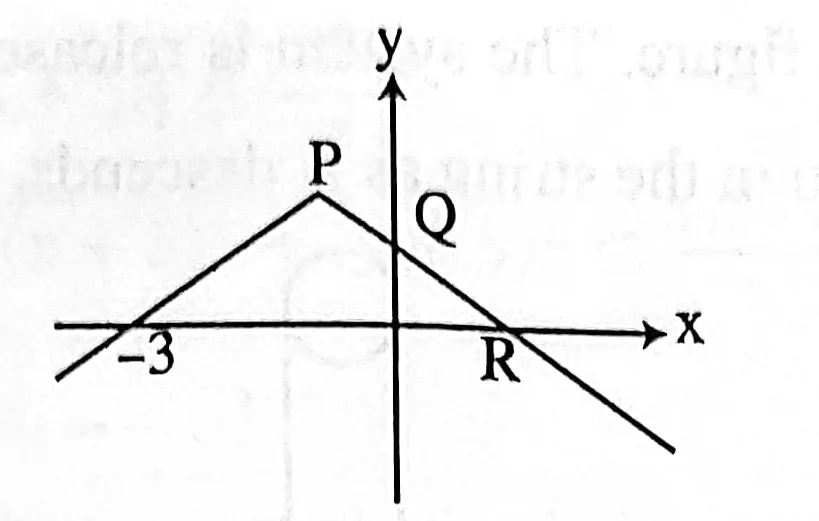
Following figure shows the graph of y=f(x), x€ℝ. The graph consists of two line segments that meet at the point P. The graph cut the y-axis at the point Q and the x-axis at the points (-3,0) and R. Find the coordinates of the point Q and R.
1.Following figure shows the graph of y=f(x), x€ℝ. The graph consists of two line segments that meet at the point P. The graph cut the y-axis at the point Q and the x-axis at the points (-3,0) and R. Find the coordinates of the point Q and R.
IUT 20-21