In the summer, a survey was conducted among 400 people about their favourite beverages. The following pie chart shows the data. Describe the chart in 150 words.
1.In the summer, a survey was conducted among 400 people about their favourite beverages. The following pie chart shows the data. Describe the chart in 150 words. 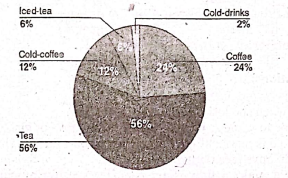
MGCC 25
সমাধান পাওয়া যায়নি।