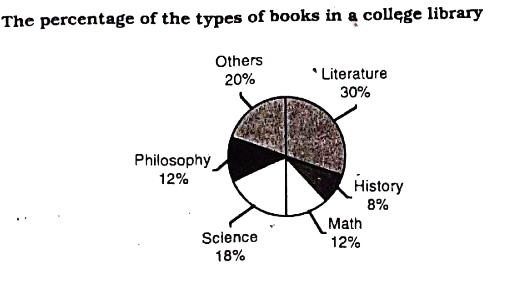
Look at the pie chart below. It shows the percentage of the types of books in a college library. Suppose, there are ten thousand books in the library. Now, describe the chart (at least in 100 words).
1.Look at the pie chart below. It shows the percentage of the types of books in a college library. Suppose, there are ten thousand books in the library. Now, describe the chart (at least in 100 words).
RCC 23JGCC 23
সমাধান পাওয়া যায়নি।