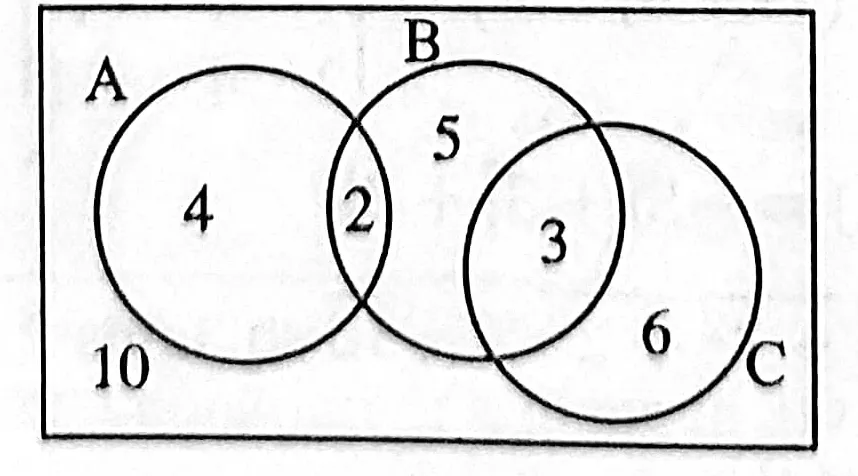
The following figure represents a Venn diagram that shows the number of students in a class who read any of 3 popular magazines A, B and C. One of these students is selected at random. Find the probability t he student reads more than one magazine.
1.The following figure represents a Venn diagram that shows the number of students in a class who read any of 3 popular magazines A, B and C. One of these students is selected at random. Find the probability the student reads more than one magazine.
IUT 20-21