The following graph displays the COVID-19 scenario (death rate) in Bangladesh in respect of age distribution in percentage. Describe the graph in your own sentences.
1.The following graph displays the COVID-19 scenario (death rate) in Bangladesh in respect of age distribution in percentage. Describe the graph in your own sentences. 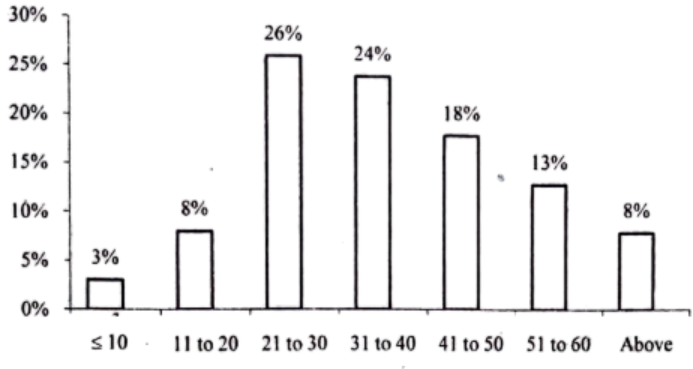
HC 24
সমাধান পাওয়া যায়নি।