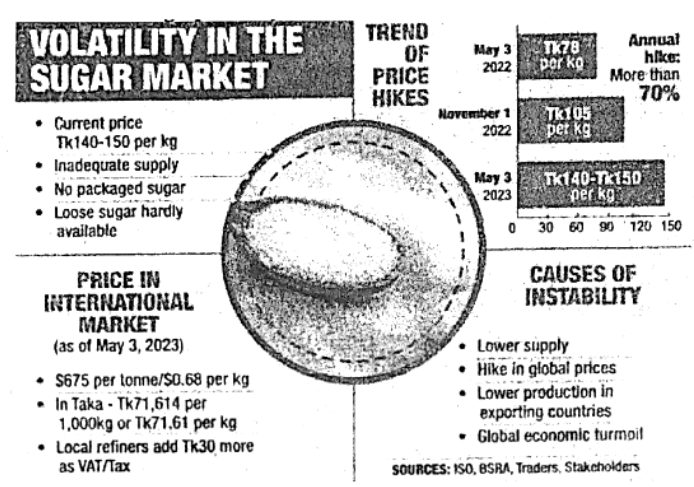
The following infographic from a newspaper shows the price hike trend of sugar in last year. Now, describe the chart/infographic in your own words. (At least in 80 words)
1.The following infographic from a newspaper shows the price hike trend of sugar in last year. Now, describe the chart/infographic in your own words. (At least in 80 words)
JCC 23
সমাধান পাওয়া যায়নি।