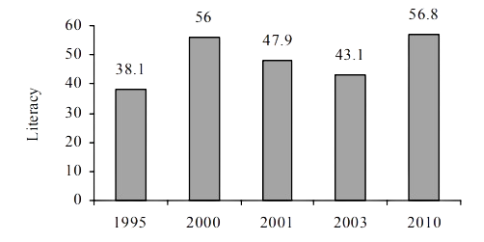
The graph below shows the literacy rate of Bangladesh from 1995 to 2010. Describe the graph in at least 150 words. You should highlight the information and report the main features given in the graph :-
1.The graph below shows the literacy rate of Bangladesh from 1995 to 2010. Describe the graph in at least 150 words. You should highlight the information and report the main features given in the graph :-
All.B 18
সমাধান পাওয়া যায়নি।