You're offline. Some features may be limited.
Suva Ai
Study Assistant
Toggle Sidebar
New Chat
প্রশ্নব্যাংক
মক পরীক্ষা
হিস্ট্রি
Recent
U
Loading...
Please wait
Toggle Sidebar
Suva AI
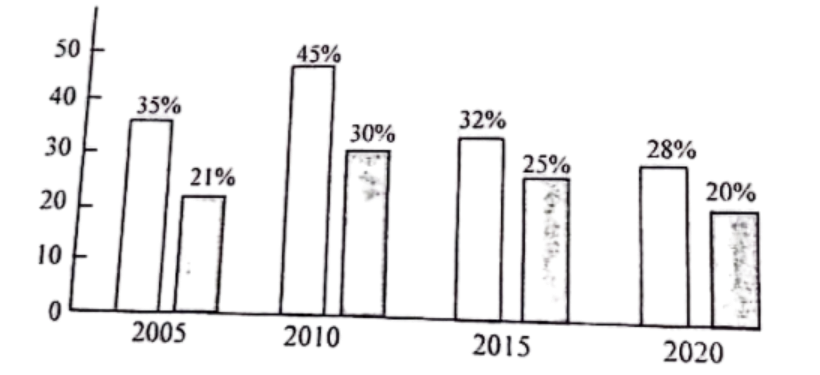
The graph below shows the number of people living below the poverty line from 2005-2020. Describe the graph:
1.
The graph below shows the number of people living below the poverty line from 2005-2020. Describe the graph:
MB 25
সমাধান পাওয়া যায়নি।
মক টেস্ট দিন: 11. Analyzing maps / graphs / charts
আনলিমিটেড মক টেস্ট দিয়ে নিজেকে যাচাই করো
বই ও বিগত বছরের সব প্রশ্ন প্র্যাকটিস করো
The graph below shows the number of people living below the poverty line from 2005-2020. Describe the graph: | Suva Ai