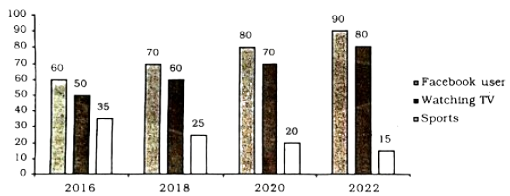
The graph below shows what percentage of time the college students in different areas of our country spend for pastime activities from 2016 to 2022 . Describe the graph in 150 words.
1.The graph below shows what percentage of time the college students in different areas of our country spend for pastime activities from 2016 to 2022 . Describe the graph in 150 words.
BCC 23
সমাধান পাওয়া যায়নি।