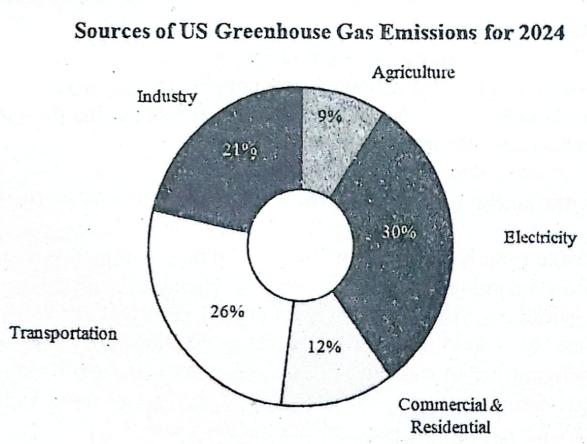
The pie chart below shows the greenhouse gas emissions for 2024 by different sectors in the USA. Summarize the information describing the chart. Write not more than 150 words.
1.The pie chart below shows the greenhouse gas emissions for 2024 by different sectors in the USA. Summarize the information describing the chart. Write not more than 150 words.
JGCC 25
সমাধান পাওয়া যায়নি।