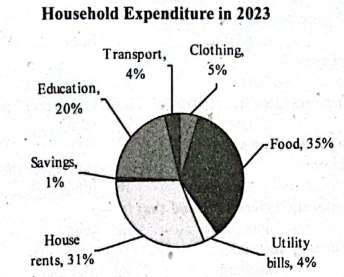
The pie chart below shows the percentage of a family's monthly income spent in the year 2023 distributed into different categories for household expenditure. Summarize the information by selecting and reporting the main features and comparisons where relevant (150-180 words).
1.The pie chart below shows the percentage of a family's monthly income spent in the year 2023 distributed into different categories for household expenditure. Summarize the information by selecting and reporting the main features and comparisons where relevant (150-180 words).
SCC 24CPSCM 23SSNIC 23BB 17
সমাধান পাওয়া যায়নি।