The pie chart below shows the percentages of transportation used by 1000 students to come to 'X College'. Now, describe the chart in 150 words.
1.The pie chart below shows the percentages of transportation used by 1000 students to come to 'X College'. Now, describe the chart in 150 words. 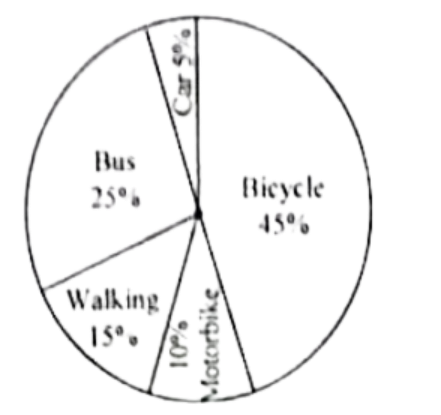
CB 25
সমাধান পাওয়া যায়নি।