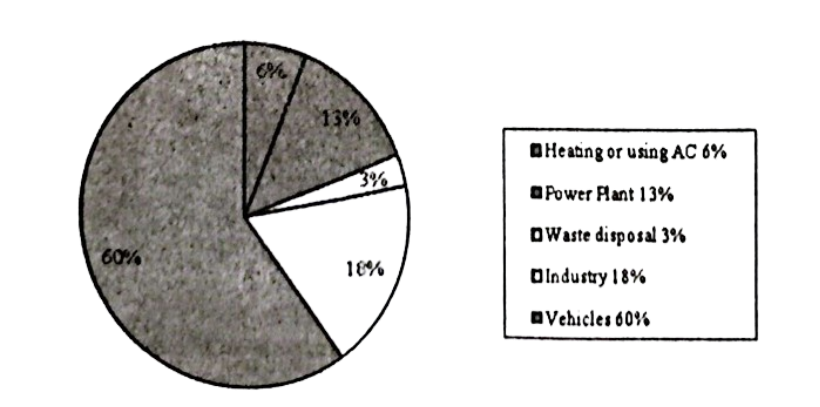
The pie chart below shows the sources of air pollution in a city. Describe the pie chart in 150 words. You should make comparison where necessary.
1.The pie chart below shows the sources of air pollution in a city. Describe the pie chart in 150 words. You should make comparison where necessary.
DC 25HC 25JGCC 25MCC 24
সমাধান পাওয়া যায়নি।